
An advanced method for modeling water-levels and estimating drawdowns
Small pumping signals can be detected reliably with water-level modeling as implemented in SeriesSEE (Halford, et al, 2012). Environmental, barometric and tidal, fluctuations exceed 0.5 ft in volcanic and carbonate rocks beneath Nevada National Security Site (Fenelon, et al, 2010). Drawdowns of less than 0.05 ft were detected routinely in observation wells despite ubiquitous natural water-level fluctuations. Drawdowns were detected greater than 3 mi from pumping wells beneath Pahute Mesa, Nevada (Garcia, et al, 2017) and 33 mi from pumping well ER-6-1-2 main beneath Yucca Flat, Nevada (Jackson and Halford, 2019).
Water-level models simulate environmental water-level fluctuations and pumping effects. Environmental water-level fluctuations are simulated by summing individual time-series of barometric pressure, tidal potential, and background water levels. Water levels from background wells, unaffected by pumping, are critical because they are affected by tidal potential–rock interaction, imperfect barometric coupling, seasonal trends, and climatic trends. Pumping schedules are transformed to water-level responses with superposition Theis models. Numerical experiments have confirmed that these Theis transforms closely approximate water-level responses through hydrogeologically complex aquifers (Garcia, et al, 2013).
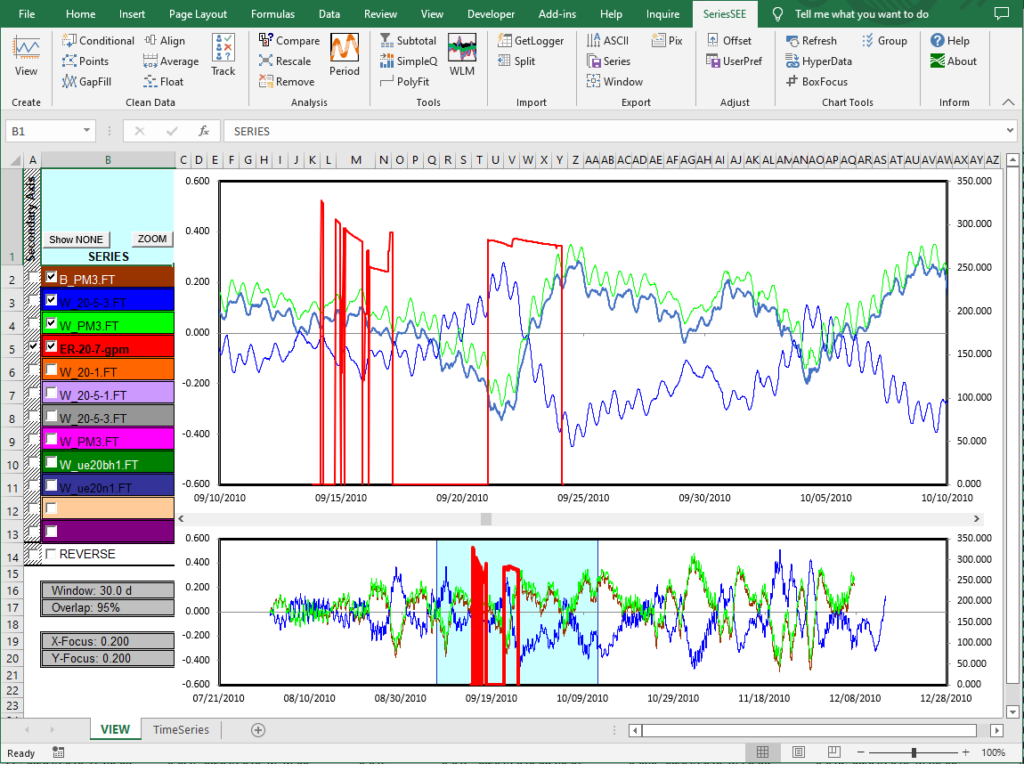
SeriesSEE is an Excel Add-In for viewing, cleaning, and analyzing time series or geophysical logs (Halford, et al, 2012). Bad data in series can be identified and removed either conditionally or graphically. Series can be added, subtracted, multiplied, or divided even where measurement frequencies are irregular, different, and asynchronous. Many other tools exist in SeriesSEE that facilitate rapid data reduction and the creation of water-level models (Figure 1).
Water-level models are created interactively with SeriesSEE in a new workbook. Synthetic water levels are simulated with a FORTRAN program where differences between synthetic and measured water levels are minimized with PEST (Doherty, 2016). Model fit is defined by RMS error and evaluated graphically. Estimated drawdowns are the summation of all Theis transforms and differences between synthetic and measured water levels. Methodology and supporting software in SeriesSEE are documented in publicly available articles (Garcia, et al, 2013) and USGS reports (Halford, et al, 2012).
Water-level models also can be simulated in a Python environment rather than Excel in the Pastas package (Collenteur, et al, 2019). Nomenclature in Pastas differs from SeriesSEE but functionality is similar.
VBA macros & Trust Center
More macro functions default to being disabled through either Microsoft updates or IT departments engaging in their natural function. Please check your Trust Center settings.
Downloads
SeriesSEE add-in, explanatory PDFs, and a few example data sets can be downloaded in the zip file AppendixA_SeriesSEE.v.2.1.zip with the following link.
Complete SeriesSEE report, appendixes, and version 2.0 add-in, can be downloaded in the zip file Release.v2.1_T+M_SeriesSEE_Appendixes.zip with the following link.
Revisions
July 18, 2016— Partially addressed international date-time issues. Added gap fill with WLM results. Added periodic weighting function. Revised SimpleQ and PolyFIT tools for compatibility with versions of Excel 2013 and greater. Added export function to split utility that converts data from SeriesSEE format to 3-column format for databases. Added PIX utility that exports selected hydrographs as GIFs in a user-defined subdirectory. Added Group utility for creating groups of series that can be changed with a single click.
September 26, 2022—Revisions in version 1.3 include the following. Corrected bug from update of Windows or Excel during August 2022, which changed naming convention of charts.
August 23, 2023—Corrected bug where magnifier identifier under global chart was out of sync with magnifier chart. Min-Max of global chart was not being set.
June 26, 2024—Added reference to Python based Pastas.
March 29, 2025—Revisions in version 2 include the following. Corrected bug where bad characters, such as “/” or “\” were not removed from file names as data were exported from SeriesSEE. Thanks to Yingyi Zhang of SMEC for identifying and pinpointing this bug.
October 14, 2025—Revisions in version 2.1 include the following. Corrected bug by revising system object to user-defined object in the form frmSETview. Thanks to Elizabeth Schwartz of Entera Geoscience for identifying this bug.
References
Collenteur, R.A., Bakker, M., Caljé, R., Klop, S.A. and Schaars, F., 2019, Pastas: Open Source Software for the Analysis of Groundwater Time Series. Groundwater, 57: 877-885. https://doi.org/10.1111/gwat.12925
Doherty, J., 2016, PEST—Model-independent parameter estimation, User manual part I—PEST, SENSAN, and global optimisers 6th ed.: Brisbane, Australia, Watermark Numerical Computing, 366 p., http://www.pesthomepage.org
Fenelon, J.M., Sweetkind, D.S., and Laczniak, R.J., 2010, Groundwater flow systems at the Nevada Test Site, Nevada: A synthesis of potentiometric contours, hydrostratigraphy, and geologic structures: U.S. Geological Survey Professional Paper 1771, 54 p., 6 pls. https://doi.org/10.3133/pp1771
Garcia, C., Halford, K. and Fenelon, J., 2013, Detecting Drawdowns Masked by Environmental Stresses with Water-Level Models. Groundwater, 51: 322-332. https://doi.org/10.1111/gwat.12042
Garcia, C.A., Jackson, T.R., Halford, K.J., Sweetkind, D.S., Damar, N.A., Fenelon, J.M., and Reiner, S.R., 2017, Hydraulic characterization of volcanic rocks in Pahute Mesa using an Integrated Analysis of 16 multiple-well aquifer tests, Nevada National Security Site, 2009–14: U.S. Geological Survey Scientific Investigations Report 2016-5151, 62 p., https://doi.org/10.3133/sir20165151.
Garcia, C.A., Halford, K.J., Gardner, P.M., and Smith, D.W., 2021, Hydraulic characterization of carbonate-rock and basin-fill aquifers near Long Canyon, Goshute Valley, northeastern Nevada: U.S. Geological Survey Scientific Investigations Report 2021–5021, 99 p., https://doi.org/10.3133/sir20215021.
Halford, K., Garcia, C.A., Fenelon, J., and Mirus, B., 2012, Advanced methods for modeling water-levels and estimating drawdowns with SeriesSEE, an Excel add-In, (ver. 1.1, July, 2016): U.S. Geological Survey Techniques and Methods 4–F4, 28 p., http://dx.doi.org/10.3133/tm4F4.
Jackson, T.R., and Halford, K.J., 2019, Estimation of groundwater flow through Yucca Flat based on a multiple-well aquifer test at well ER-6–1–2 main, Nevada National Security Site, southern Nevada: U.S. Geological Survey Scientific Investigations Report 2019–5038, 27 p., https://doi.org/10.3133/sir20195038.