
Regulators such as Nevada Division of Water Resources (NDWR) need to estimate capture of streamflow by pumping (Nevada State Engineer, 2021). Analytical and numerical models have been deemed appropriate tools by NDWR for estimating capture from withdrawals of a groundwater right. Analytical models facilitate rapid analysis because input requirements are minimal. Numerical models can better approximate heterogeneous hydraulic properties and discharges to streams and phreatophytes (Barlow and Leake, 2012), but analyses generally are not rapid.
The Glover solution (Jenkins, 1968) likely is the most frequently applied analytical model, because spreadsheet solutions have been readily available (Hunt, 2005; Environment Canterbury, 2024). The Glover solution, like many other analytical solutions, assumes an infinite, homogenous, and isotropic aquifer that is penetrated fully by a straight-line stream and pumping well. These superficially concerning assumptions are not the primary limitation.
Analytical estimates primarily are limited by not simultaneously simulating potential capture from streams and evapotranspiration. Other analytical solutions more thoroughly characterize connection between aquifer and stream (Hunt, 2003), but do not simulate distributed discharge as evapotranspiration. This is a significant limitation where pumped water comes from storage and capture of discharge to streams and evaporation.
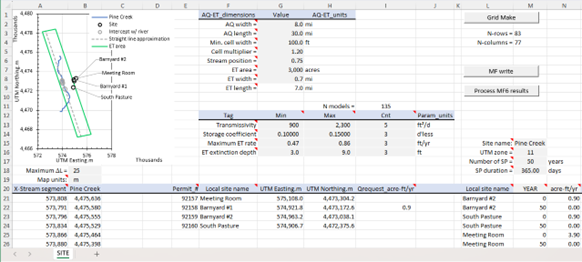
Simultaneous capture from streams and evapotranspiration can be analyzed rapidly with simplified numerical models that are created, executed, and synthesized with the current version of the CaptureMF6 workbook. Aquifer, evapotranspiration area, and stream are defined with simple geometries and homogeneous properties to limit input requirements. Aquifer and evapotranspiration area extents are defined by lengths and widths. These areas are centered where pumping wells are projected on a straight-line approximation of the stream that bisects the aquifer (Figure 1). Lateral discretization is limited to specifying uniform, square cells in the evapotranspiration area and expanding row heights and column widths by a single multiplier to the aquifer extents (Figure 1). Vertical discretization is fixed at thicknesses of 1 and 99 ft in layers 1 and 2, respectively.
Simple, numerical models created by the CaptureMF6 workbook simulate change from pumping with the same superposition assumptions in the Glover solution (Jenkins, 1968). All initial heads are 0 ft and heads are 0 ft in single stream that is simulated with constant-head package (Langevin, et.al., 2017). The straight-line stream is simulated in layer 1 of a single column that spans all rows. This straight-line approximation is a regressed fit to the user-specified stream segment
(Figure 1).
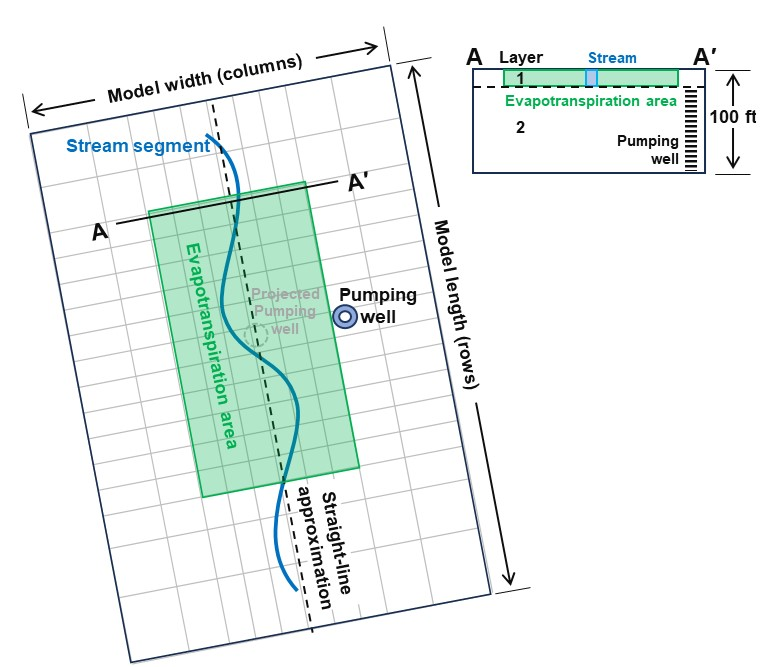
Capture from the evapotranspiration area is rate limited and is simulated with two MODFLOW packages, evapotranspiration (EVT) and well (WEL) (Langevin, et.al., 2017). This capture-limited boundary limits the total capture of discharge to the maximum evapotranspiration rate after simulated drawdown exceeds the extinction depth of evapotranspiration (Halford and Plume, 2011; p. 35). The WEL package simulates injection of water into a model cell, while EVT package simulates removal of water from the same model cell. Injection from the WEL package equals cell area times maximum evapotranspiration rate to balance discharge from the EVT package in the same cell. No capture occurs initially when simulated head is 0 and equals the elevation of the ET surface. As simulated water levels decline, injected volumes do not change, while EVT discharge decreases. Capture from the evapotranspiration area is the sum of volumes injected with the WEL package and discharged with the EVT package. Cells in WEL and EVT packages are assigned to layer 1 (Figure 1).
Significant hydraulic properties and evapotranspiration parameters are defined with ranges so potential capture can be estimated with multiple models. These parameters are transmissivity (T), specific yield (Sy), maximum evapotranspiration rate (ETr), and extinction depth of evapotranspiration (ETd). Synthesizing multiple MODFLOW6 model results in a new workbook facilitates rapidly viewing effects of tested parameters on stream and evapotranspiration capture. Ratio of horizontal to vertical hydraulic conductivity and specific storage were specified because these parameters are less significant than T, Sy, ETr, and ETd.
Pumping wells are simulated with constant or time-varying rates in a second WEL package. Pumpage is assigned to the nearest cell that contains mapped coordinates and is assigned vertically to layer 2 (Figure 1). Pumping from wells can be specified as a constant rate or vary with time. Time-varying, pumping rates are specified at user-specified times and distributed to annual stress periods. Pumping rates can be specified in acre-feet per year (acre-ft/yr), cubic feet per second (ft³/s), gallons per minute (gpm), cubic feet per day (ft³/d), cubic meters per day (m³/d), or cubic meters per second (m³/s).
Simulation period is user defined and automatically divided into annual stress periods. Analyzing 50 or 100 years of pumping would be simulated with 50 or 100 stress periods, respectively. Annual periods can be defined as 365 or 365.25 days to conform with regulatory specifications.
Verification with Analytical Solution
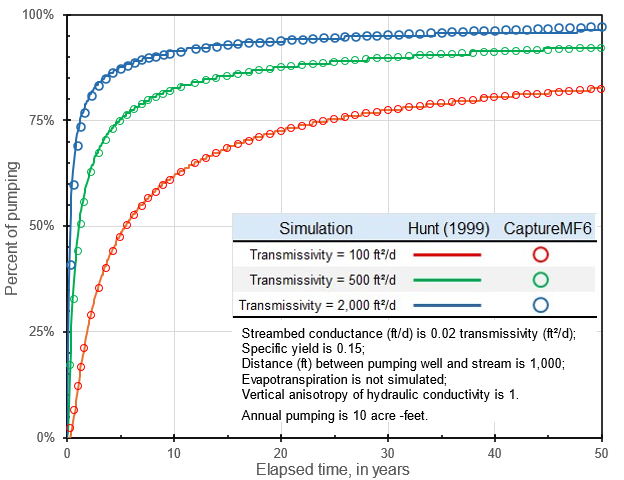
Simulated capture with CaptureMF6 was verified by comparison with an analytical solution that simulates a partially penetrating stream (Hunt, 1999). The Hunt (1999) solution is similar to the Glover solution (Jenkins, 1968) except that the infinite, straight-line stream is partially penetrating instead of bisecting the aquifer. Vertical resistance between stream and aquifer is approximated with streambed conductance in an otherwise isotropic aquifer. The Hunt (1999) solution was solved with the program STRMDEPL08 (Reeves, 2008).
Simulated stream captures were similar with both Hunt (1999) solution and CaptureMF6 (Figure 2). Typical transmissivities of 100, 500, and 2,000 ft²/d were tested. Pumping well being 1,000 ft from the stream and specific yield being 0.15 were specified explicitly in both analytical and numerical models. Streambed conductance (ft/d) only exists in Hunt (1999) and was defined as 0.02 times specified transmissivity (ft²/d). Evapotranspiration was not simulated and vertical anisotropy of hydraulic conductivity was specified as 1 in CaptureMF6 to match assumptions in Hunt (1999).
Pine Creek example
Estimating capture from a stream and evapotranspiration area will be illustrated with an example from Pine Valley, hydrographic area (HA) 053 (Figure 3). A total of 6.6 acre-ft/yr was proposed to be pumped from four points of diversion that ranged between 2,400 and 3,500 ft from Pine Creek. Maximum stream capture ranged between 5 and 6 acre-ft/yr with a Glover analysis and transmissivity estimates between 900 and 2,300 ft²/d (Braumiller, 2023). This exceeded the annual pumping exemption of 5 acre-ft in section 3C of order 1329 (Nevada State Engineer, 2021), which prompted further analysis.
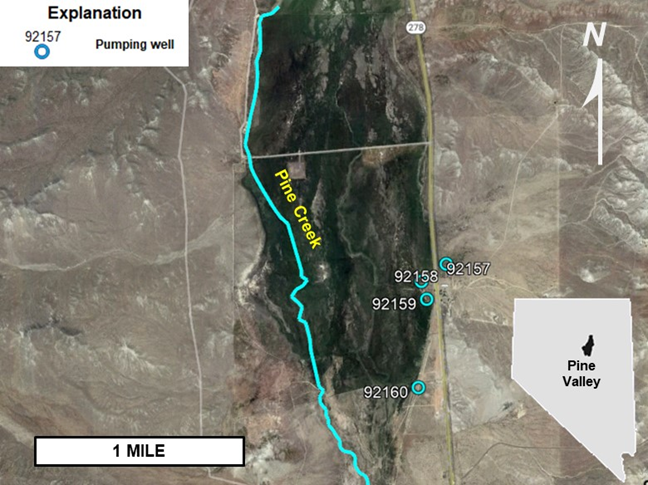
Capture from evapotranspiration at the Pine Creek site is likely with greater than 0.5 mi of evapotranspiration area between Pine Creek and proposed points of diversion (Figure 3). About 4,000 acres of groundwater evapotranspiration (ETgw) were mapped between 4 mi upstream and 3 mi downstream of the proposed points of diversion (Huntington, et.al., 2022).
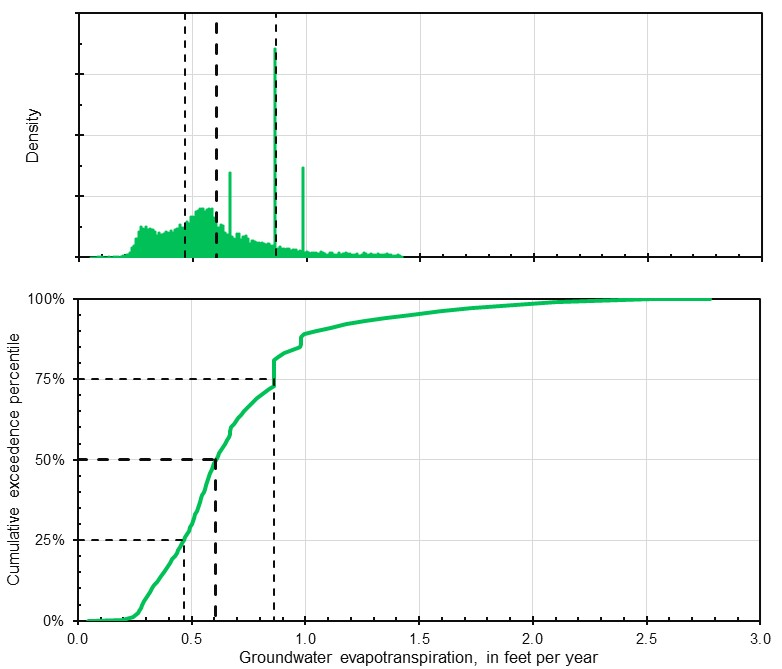
Probability of ETgw rate from the evapotranspiration area was defined with greater than 17,000 estimates (Figure 4). Each estimate was an average rate from a 30-m on a side raster (Huntington, et.al., 2022). Annual estimated ETgw rates ranged between <0.1 and 2.8 ft and averaged 0.6 ft. More probable rates for half the ETgw discharge ranged between 0.5 and 0.9 feet per year (ft/yr). Reduction of raster-based estimates of ETgw is demonstrated in the companion workbook fig04_Example-of-GWET-PDF.xlsx.
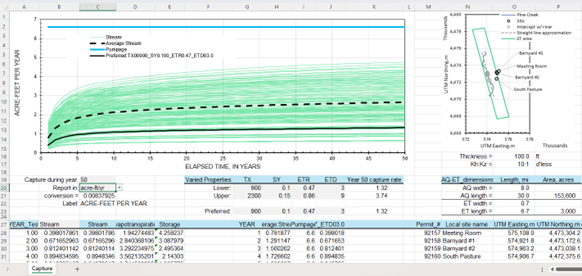
Pine Creek site was reanalyzed using the CaptureMF6 workbook so that capture from evapotranspiration could be estimated in addition to stream capture from Pine Creek (Figure 5). Transmissivity ranged between 900 and 2,300 ft²/d as in the previous Glover analysis (Braumiller, 2023). Specific yield ranged between 0.1 and 0.2. Maximum evapotranspiration rate ranged between 0.5 and 0.9 ft/yr. Extinction depth of evapotranspiration ranged between 3 and 9 ft.
Annual stream and evapotranspiration capture averaged 3.4 and 2.5 acre-ft, respectively, in the CaptureMF6 analysis (Figure 6). Total annual capture of 5.9 acre-ft from the CaptureMF6 analysis was similar to capture estimates from the previous Glover analysis (Braumiller, 2023). Results primarily differed because the CaptureMF6 analysis more realistically simulated evapotranspiration capture.
VBA macros & Trust Center
More macro functions default to being disabled through either Microsoft updates or IT departments engaging in their natural function. Please check your Trust Center settings.
Zip file can be downloaded with the following link.
UNZIP FIRST!!! Workbook and MF6.exe will not work in a zip file.
The file CaptureMF6.v5.zip contains,
- .\CaptureMF6\CaptureMF6.v5.xlsm – Workbook with macros for,
1.) Defining stream, ET area, and wells in user-defined MF6 grid;
2.) Writing family of alternative MF6 models is individual folders and batch files to execute all MF6 models; and
3.) Reading all MF6 model results, reducing output frequency, and synthesizing results in a new workbook. - fig04_Example-of-GWET-PDF.xlsx – Auxiliary workbook for estimating range of groundwater evapotranspiration (ETgw) rates from raster rates in OpenET (Huntington, et.al., 2022).
- .\bin\MF6.exe – MF6 version 6.0.4 executable.
- CaptureMF6-EXPLAIN.v5.pdf – Explanatory document
Revisions
February 9, 2024 —Revisions through version 1 are initial release.
April 14, 2024 —Revisions in version 2 include. River can be positioned between the left and right edges of the ET area. Added a “Local conditions” series to results workbook that depicts representative local conditions with a singular realization.
September 28, 2024 —Revisions in version 3 include. Simulation duration can be changed. Number of stress periods are user defined, where each stress period simulates a year. Pumping from wells can be specified as a constant rate or vary with time.
October 11, 2024 —Revisions in version 4 include. Corrected mistake in depicting ET area relative to stream position, which was reversed in map plot on SITE page.
February 24, 2025 —Revisions in version 5 include. Revised terminology and reporting frequency for greater consistency with Nevada Department of Water Resources (NDWR). Revised so that capture could be reported as percentage of pumping in addition to user-specified flow units. Reporting tabulates capture at user-specified time, which usually is 50 years for NDWR. Workbook revised so that UTM map units can be specified in feet (ft) or meters (m). Added macro to write KML with PODs, digitized stream, straight-line approximation, ET area, and model extent. Revised code to register working directory with workbook location and check for destabilizing elements. Verified MF6 results by comparison to an analytical solution (Hunt, 1999) in revised documentation.
March 4, 2025 —Revisions in version 6 include. Shifted local X-grid by half of minimum grid width to correct error in stream (CHD) creation. Error occurred where number of columns was even. Added filter to reduce points in discretized stream and introduce gaps if stream represented by multiple, discontinuous polylines. Added option to center straight-line stream approximation on sub-reach of discretized stream reach, where pumping wells are projected on a straight-line approximation of the stream.
Suggested Citation
Halford, Keith, 2025, CaptureMF6—Estimate stream and evapotranspiration capture with simple MODFLOW6 models, version 6, Halford Hydrology LLC web page, accessed March 2025, at https://halfordhydrology.com/capturemf6/
References
Barlow, P.M., and Leake, S.A., 2012, Streamflow depletion by wells—Understanding and managing the effects of groundwater pumping on streamflow: U.S. Geological Survey Circular 1376, 84 p. http://pubs.usgs.gov/circ/1376/
Braumiller, S., 2023, Capture analysis for applications 92157-92160 by Nevada Gold Mines, LLC in Pine Valley Hydrographic Basin (HA 053), memorandum from Nevada Department of Water Resources, October 25,2023, 12 p.
Environment Canterbury, 2024, Groundwater tools and resources, Environment Canterbury Regional Council web page, accessed February 2024, https://www.ecan.govt.nz/your-region/your-environment/water/tools-and-resources/
Glover, R.E., and Balmer, C.G., 1954, River depletion resulting from pumping a well near a river: American Geophysical Union Trans., v. 35, pt. 3, p. 468-470. https://doi.org/10.1029/TR035i003p00468
Halford, K.J., and Plume, R.W., 2011, Potential effects of groundwater pumping on water levels, phreatophytes, and spring discharges in Spring and Snake Valleys, White Pine County, Nevada, and adjacent areas in Nevada and Utah: U.S. Geological Survey Scientific Investigations Report 2011-5032, 52 p. https://doi.org/10.3133/sir20115032
Hunt, B., 1999, Unsteady Stream Depletion from Ground Water Pumping. Groundwater, 37: 98-102. https://doi.org/10.1111/j.1745-6584.1999.tb00962.x
Hunt, B, 2003, Unsteady stream depletion when pumping from semi-confined aquifer. Journal of Hydrologic Engineering 8, no. 1: 12-19.
Hunt, B., 2005, Visual Basic Programs for Spreadsheet Analysis. Groundwater, 43: 138-141. https://doi.org/10.1111/j.1745-6584.2005.tb02293.x
Huntington, J. L., Bromley, M., Minor, B., Morton, C. G., and Smith, G., 2022, Groundwater Discharge from Phreatophyte Vegetation, Humboldt River Basin, Nevada, Desert Research Institute Publication No. 41288, prepared for Nevada Department of Conservation and Natural Resources, Division of Water Resource, 46 p.
https://www.dri.edu/project/humboldt-etg/
Jenkins, C.T., 1968, Computation of rate and volume of stream depletion by wells: U.S. Geological Survey Techniques and Methods, book 4, chap. D1, 17 p., https://pubs.usgs.gov/twri/twri4d1
Langevin, C.D., Hughes, J.D., Banta, E.R., Niswonger, R.G., Panday, Sorab, and Provost, A.M., 2017, Documentation for the MODFLOW 6 Groundwater Flow Model: U.S. Geological Survey Techniques and Methods, book 6, chap. A55, 197 p., https://doi.org/10.3133/tm6A55.
Nevada State Engineer, 2021, State Engineer’s Order No. 1329— Establishing Interim Procedures for Managing Groundwater Appropriations to Prevent the Increase of Capture and Conflict with Rights Decreed Pursuant to the Humboldt River Adjudication, Carson City, Office of the State Engineer of the State of Nevada, 13 p., http://images.water.nv.gov/images/Orders/1329o.pdf
Reeves, H.W., 2008,STRMDEPL08—An extended version of STRMDEPL with additional analytical solutions to calculate streamflow depletion by nearby pumping wells: U.S. Geological Survey Open-File Report 2008–1166, 22 p. https://doi.org/10.3133/ofr20081166
Theis, C.V., 1940, The source of water derived from wells—Essential factors controlling the response of an aquifer to development: Civil Engineering, v. 10, no. 5, p. 277–280. https://water.usgs.gov/ogw/pubs/Theis-1940.pdf