
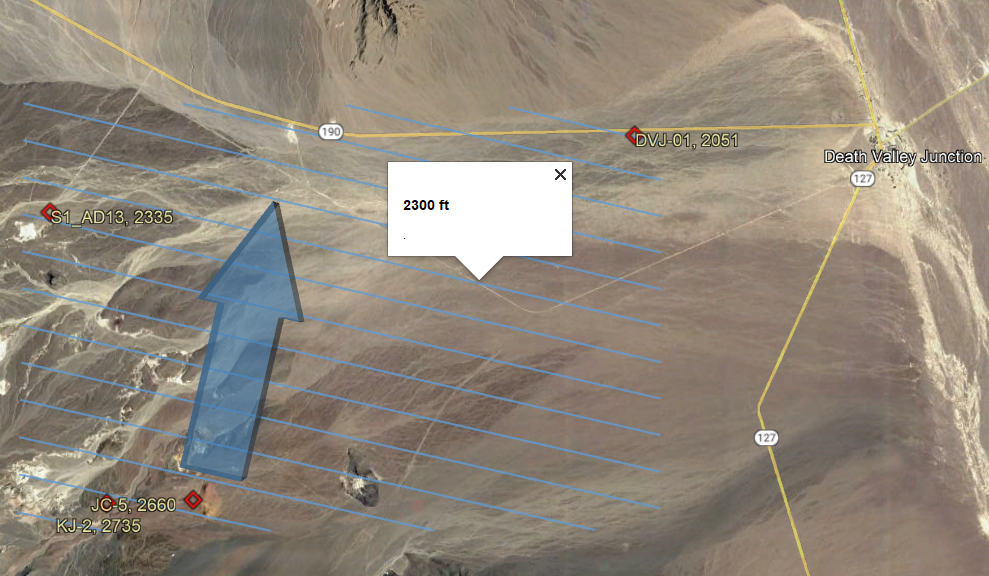
Groundwater wells, potentiometric surface, and flow direction can be mapped in a KML file with the KML_3Point-Flow.v?.xlsm workbook (Figure 1). Potentiometric surface is simulated by fitting a planar surface to groundwater levels from between 3 and 24 wells. Appropriateness of fitting a 3-point problem to greater than three wells can be evaluated with a scatter plot of measured and simulated water levels. Posting of names, measured water levels, simulated water levels, residuals, and weights are specified by the user.
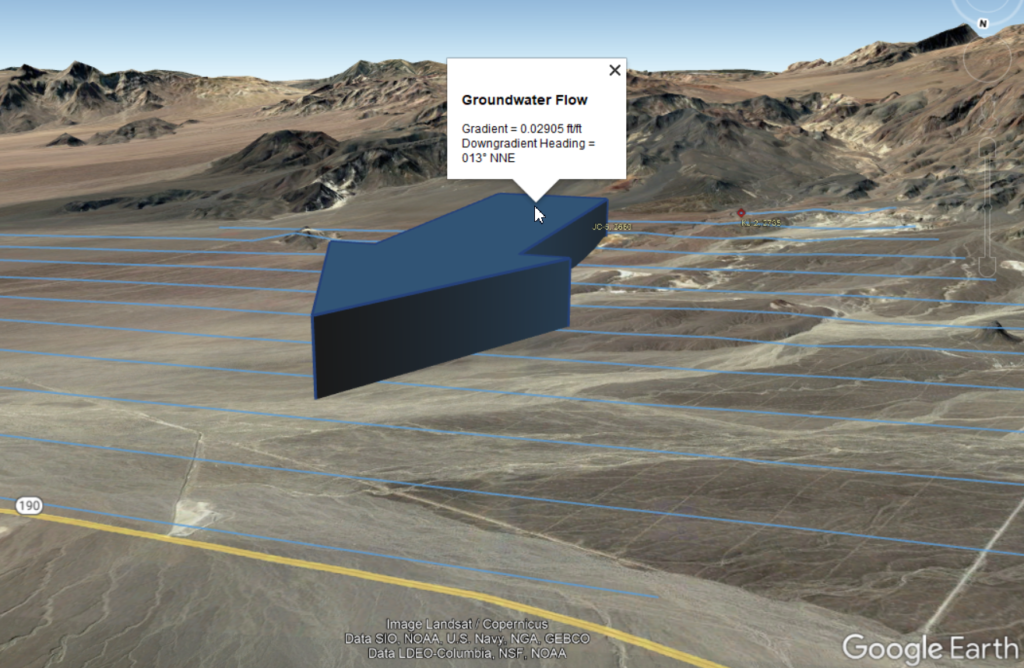
Groundwater-flow direction is depicted with a three-dimensional arrow that can be scaled by the user (Figure 2). Groundwater gradient and downgradient compass heading are reported if arrow is selected in Google Earth.
KML_3Point-Flow.v3.xlsm and explanatory PDF can be downloaded with the following link.
VBA macros & Trust Center
More macro functions default to being disabled through either Microsoft updates or IT departments engaging in their natural function. Please check your Trust Center settings.
Download
Revisions
March 8, 2021—Versions 1 and 2 were created during development.
December 7, 2021—Revisions in version 3 include the following. Workbook modified so that well locations can be specified with decimal latitude-longitude or UTM coordinates. Explanatory comments were added to labels on XYZ page.
February 23, 2024—Revisions in version 4 include the following. Safeguards were added to check that the Solver is installed and the workbook is not opened from within a zip file.