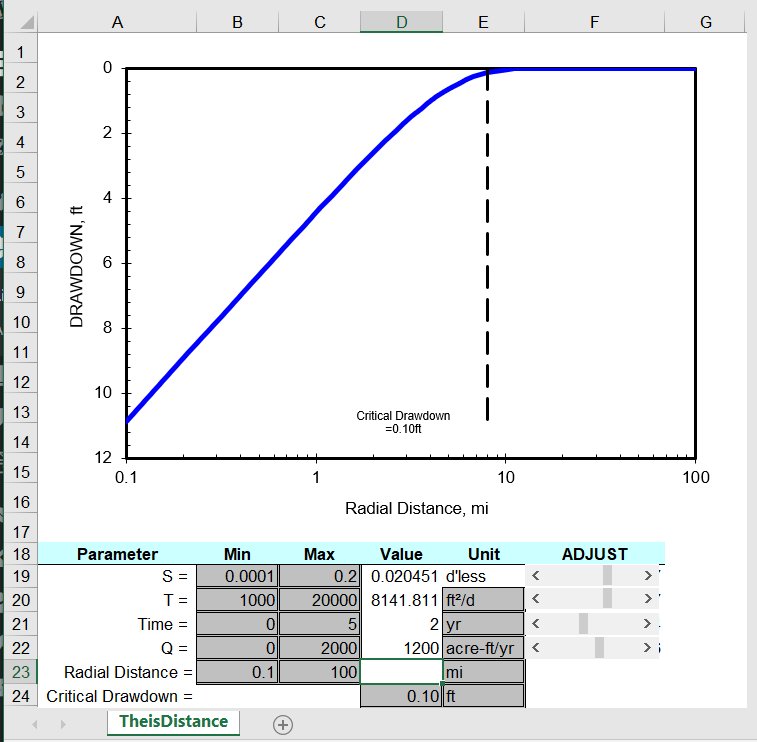
Drawdowns are predicted as function of distance with the Theis (1935) solution in the Analytical_DistanceDrawdown.xlsm workbook (Figure 1). Ranges of storage coefficient (S), transmissivity (T), time (t), and flow rate (Q) are specified in columns B and C. User-defined units are specified in column E. Individual S, T, time, and Q are specified and changed with sliders in column F. A critical drawdown can be specified, which is annotated on the plot (Figure 1).

Analytical_DistanceDrawdown.xlsm and explanatory PDF can be downloaded with the following link.
References
Halford, K.J. and E.L. Kuniansky 2002, Documentation of spreadsheets for the analysis of aquifer pumping and slug test data, USGS OF 02-197 https://pubs.usgs.gov/of/2002/ofr02197/
Theis, C.V., 1935, The relation between the lowering of the Piezometric surface and the rate and duration of discharge of a well using ground-water Storage: Transactions of the American Geophysical Union, v. 16, no. 2, p. 519–524, https://doi.org/10.1029/TR016i002p00519.
