Slug tests frequently are analyzed with Bouwer and Rice (1976) to estimate hydraulic conductivities. Hydraulic conductivity is estimated by fitting a straight line to normalized displacements on a logarithmic axis vs. time on an arithmetic axis in a semi-log plot (Halford and Kuniansky, 2002). This approach works well for overdamped responses where water levels monotonically return to initial conditions.
Slug tests with oscillating or underdamped responses can be analyzed with the KGS model (Butler and Garnett, 2000), which simulates oscillating water levels. These oscillations result from the momentum of a water column in a well not being damped because the aquifer is transmissive. The KGS model smoothly simulates slug-test responses from underdamped to overdamped conditions and can be used in place of Bouwer and Rice (1976).
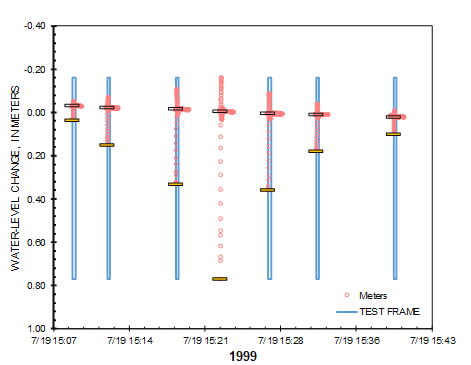
Multiple slug tests frequently occur in a well to verify repeatability and detect errors during data collection. More sequential slug tests typically occur where water levels can recover quickly (less than 5 minutes). These repeated tests create a time series of perturbed water levels (Figure 1). Water-level changes are normalized by dividing all changes during a test by the peak displacement. Peak displacement is the difference between maximum change and initial water level during each test. Absolute values of normalized displacements will be 1 or less.

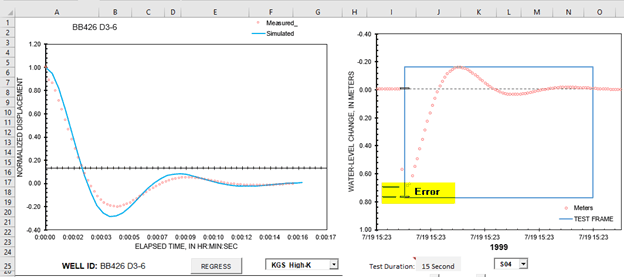
Measurement errors can occur during a slug test when transducer depth is affected by adding or removing a slug. Transducers can be lifted momentarily during slug removal, which increases apparent water-level change. For example, maximum measured displacement was overestimated during the 4th slug test in well BB426 D3-6 (Figure 2). This error can be corrected by adjusting estimated maximum water-level change or negated by not analyzing this slug test.

(Butler and Garnett, 2000).
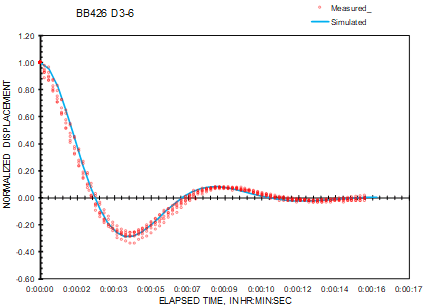
All normalized slug-test responses overlie one another and can be analyzed simultaneously (Figure 3). Slug-test responses coincide regardless of initial displacement during each test. Discrepancies between slug-test responses primarily result from misestimated initial displacements. A single simulated response is fit to all measured displacements and can be simulated with either Bouwer and Rice (1976) or KGS model (Butler and Garnett, 2000).

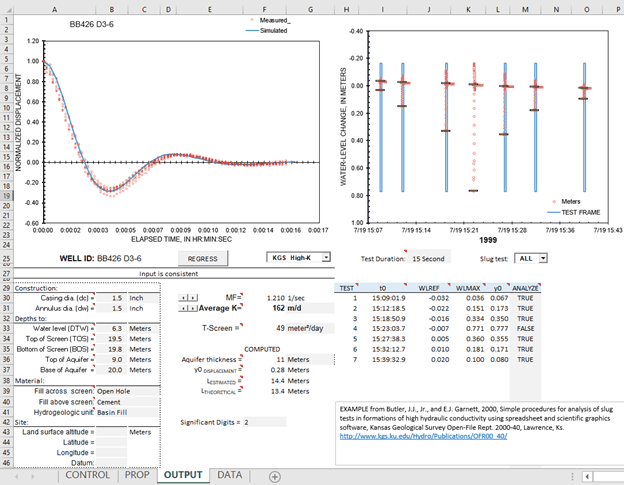
Interpretation of repeated slug tests with Bouwer and Rice (1976) or KGS models (Butler and Garnett, 2000) has been implemented in the workbook Slug_KGS-BnR-2019.xlsm (Figure 4). A continuous series of water levels with slug displacements are specified as depth to water or water level above the transducer. Measured water levels are plotted as a time series with periods of analysis superimposed (Figure 4). Individual slug tests and normalized displacements can be viewed to assess initial reference and maximum water-level estimates (Figure 2). These defining water levels can be changed for each slug test or analysis of a slug test can be rejected. Normalized displacements to be analyzed are plotted on semi-log or cartesian plots for analysis with Bouwer and Rice (1976) or KGS model (Butler and Garnett, 2000), respectively (Figure 4). Hydraulic conductivity (K) initially is estimated from a linear regression and refined graphically when interpreted with Bouwer and Rice (1976). Hydraulic conductivity and modulation factor (MF) are estimated simultaneously with Solver to fit the KGS model (Butler and Garnett, 2000). Hydraulic conductivity and modulation factor can be adjusted manually with spin buttons. Hydraulic conductivity is reported with a user defined number of significant digits.

Slug_KGS-BnR-2019.v2.xlsm and explanatory PDF can be downloaded with the following link. Another copy of the workbook, Slug_KGS-BnR-2019_BnR.v2.xlsm, is included with an overdamped response that was interpreted with Bouwer and Rice (1976). This workbook and other workbook applications are better used on local drives instead of a network drive. Slug_KGS-BnR-2019_*.v3.xlsm workbooks require that the Solver is installed and the workbook is not opened from within a zip file. The fitting routine will stop and warn the user if the Solver is not installed. User will be warned and workbook will be closed if opened from within a zip file.
Revisions
October 6, 2022—Revisions in version 2 include the following. Workbook was revised to accommodate response from a single slug without initial static water levels in the continuous measurements. Reference water level on data page changed from average of all values to last 5 percent if single slug measured. Reference remains average of all measurements if multiple slugs measured. Initialization macro called from DATA page revised so first entry is initial time and maximum water-level displacement for analyzing a single slug without initial static water levels.
October 18, 2022—Revisions in version 3 include the following. Safeguards were added to check that the Solver is installed and the workbook is not opened from within a zip file.
Suggested Citation
Halford, Keith, 2022, Slug_KGS-BnR-2019–A workbook for analyzing slug tests with Bouwer-Rice and KGS solutions, version 3, Halford Hydrology LLC web page, accessed November 2022, at https://halfordhydrology.com/slug_kgs-bnr-2019/
References
Bouwer, H., and R.C. Rice. 1976. A slug test for determining hydraulic conductivity of unconfined aquifers with completely or partially penetrating wells. Water Resour. Res. 12, no. 3: 423-428. https://agupubs.onlinelibrary.wiley.com/doi/abs/10.1029/WR012i003p00423
Butler, J.J., Jr., and E.J. Garnett, 2000, Simple procedures for analysis of slug tests in formations of high hydraulic conductivity using spreadsheet and scientific graphics software, Kansas Geological Survey Open-File Rept. 2000-40, Lawrence, Ks. http://www.kgs.ku.edu/Hydro/Publications/OFR00_40/
Butler, J. J., Garnett, E. J. and Healey, J. M. (2003), Analysis of Slug Tests in Formations of High Hydraulic Conductivity. Groundwater, 41: 620-631. doi:10.1111/j.1745-6584.2003.tb02400.x https://ngwa.onlinelibrary.wiley.com/doi/abs/10.1111/j.1745-6584.2003.tb02400.x
Halford, K.J. and E.L. Kuniansky 2002, Documentation of spreadsheets for the analysis of aquifer pumping and slug test data, USGS OF 02-197 https://pubs.usgs.gov/of/2002/ofr02197/
