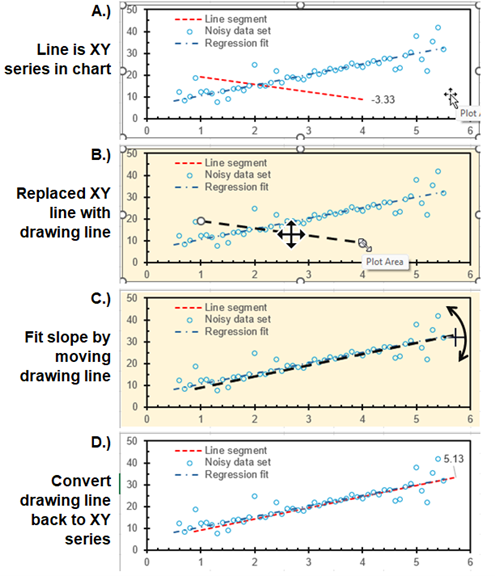
Graphical techniques of estimating slopes frequently are more expedient than regression techniques, where data sets are noisy (Figure 1). Graphically fitting a line sufficiently estimates the slope of interest without having to explicitly identify all outliers for exclusion from a regression. Line segments can define a slope and be plotted as additional series in Excel XY-scatter plots. The endpoints of these line segments must be moved by changing values in ranges and cannot be manipulated directly through the chart (Figure 1).

Line segments can be adjusted graphically with the macro GraphicalSlopeSET in the workbook SlopeFinderTOOL.v2.xlsm that temporarily replaces a line segment in a series with a drawing line (Figure 2). The macro GraphicalSlopeSET acts on a selected chart, which is in a workbook other than SlopeFinderTOOL.v2.xlsm. Permissible line segments are identified, which is limited to 1 permissible segment in this example (Figure 2A). Execute macro GraphicalSlopeSET. Selected segment in series is replaced with a drawing line and chart background is changed (Figure 2B). Drawing line is moved and changed to estimate slope of noisy data set (Figure 2C). Execute macro GraphicalSlopeSET again. Coordinates are computed from drawing line and assigned to range that defines line segment in a series. Drawing line is removed and chart background is restored (Figure 2D).

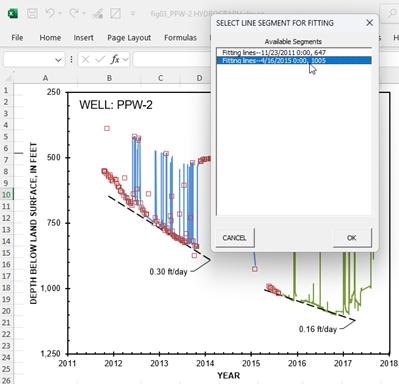
Multiple line segments can be estimated in complex charts (Figure 3). A form titled “SELECT LINE SEGMENT FOR FITTING” will appear after a chart is selected and the macro GraphicalSlopeSET is executed (Figure 4). All permissible segments are listed on the form and are labelled by the series name and the first pair of XY values that define a segment. Permissible segments are pairs of points bounded by blank cells or the end of the range that defines the series. Permissible segments also are restricted to series with less than a user-defined, maximum number of points in series, which is 12 by default. Permissible segments optionally exclude segments that contain equations because the macro GraphicalSlopeSET will replace equations with values. Excluding segments with equations is the default setting.


The macro GraphicalSlopeSET can be launched multiple ways, but the Quick Access Toolbar (QAT) is recommended strongly as the preferred method. A chart, a series in a chart, or a point in a series in a chart is selected initially and the macro GraphicalSlopeSET is executed. The macro GraphicalSlopeSET can be launched from the macro form, which is launched from the macros button on the Developer tab of the Excel ribbon or with the keyboard shortcut Alt+F8. Alternatively, the macro GraphicalSlopeSET can be assigned to the QAT, while the workbook SlopeFinderTOOL.v2.xlsm is open and active. Step-by-step instructions are explained by Ablebits.com on the page, How to add a macro button to Quick Access Toolbar.
The file SlopeFinderTOOL.v2.zip contains,
- Macro for graphically estimating slopes from line segments in SlopeFinderTOOL.v2.xlsm,
- Example file TestCharts.xlsx, and
- Explanatory document, SlopeFinder-EXPLAIN.v2.pdf.
Zip file can be downloaded with the following link.
Revisions
November 10, 2024—Revisions through version 1 are initial release.
November 11, 2024—Revisions in version 2 include the following. Corrected error that incorrectly handled workbook file names with delimiter strings, such as “(“ or “)”.
Suggested Citation
Halford, Keith, 2024, SlopeFinderTOOL—Graphical slope estimation tool for line segments in Excel XY charts, version 2, Halford Hydrology LLC web page, accessed November 2024, at https://halfordhydrology.com/slope-finder-tool-graphically-estimate-slopes/
