Single-well aquifer tests frequently are analyzed with Cooper-Jacob (1946) and Theis recovery (Jacob, 1963) methods because analyses are simple. Transmissivity is estimated by fitting a straight line to drawdowns or residual drawdowns on an arithmetic axis vs. time on a logarithmic axis in a semi-log plot. Transmissivities are inversely proportional to slopes of lines in both methods. Drawdowns and residual drawdowns in confined and unconfined aquifers have been analyzed by many practitioners using both methods, regardless of differences between field conditions and theory. Estimates from these constant rate tests frequently represent aquifer transmissivities despite mismatches between field conditions and theory (Halford and others, 2006).
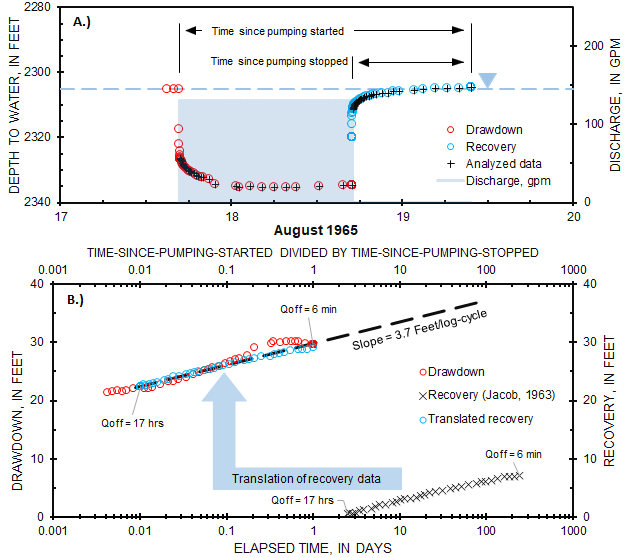
Slopes of drawdowns and residual drawdowns are identical, but plotted data during drawdown and recovery are displaced (Figure 1). Drawdowns are displaced along the Y-axis because well loses increase overall drawdown during pumping. This displacement generally is uniform because flow rate should be constant while pumping. Residual drawdowns are plotted on a transformed X-axis of time-since-pumping-started divided by time-since-pumping-stopped, Δt-Qstart/Δt-Qstop (Jacob, 1963). Increasing time plots to the left with transformed recovery data, where Δt-Qstart/Δt-Qstop have large values when recovery starts and theoretically diminish to 1 after infinite recovery (Figure 1). Plotted positions of drawdown and residual drawdown data are largely irrelevant because estimated slopes determine transmissivity estimates.

Figure 1.— Examples of pumping test results in well UE-19fS (2565-4779 ft) from August 1965. A, Cartesian plot of changes in depth to water relative to drawdown and recovery; B, Semi-log plot of translated recovery data combined interpretation of drawdown and recovery.
Residual drawdowns can be displaced to coincide with drawdowns so that drawdown and recovery could be interpreted simultaneously with a single line (Figure 1). Translated recovery data is shifted left on the X-axis of Δt-Qstart/Δt-Qstop so that the first recovery observation coincides with the last drawdown observation. Translated recovery data is shifted up on the Y-axis by the difference between averages of drawdowns and residual drawdowns (Figure 2). Translation does not affect the slope so drawdown and recovery data can be interpreted simultaneously. This approach is a refinement of previously developed workbooks (Halford and Kuniansky, 2002; Frus and Halford, 2018).
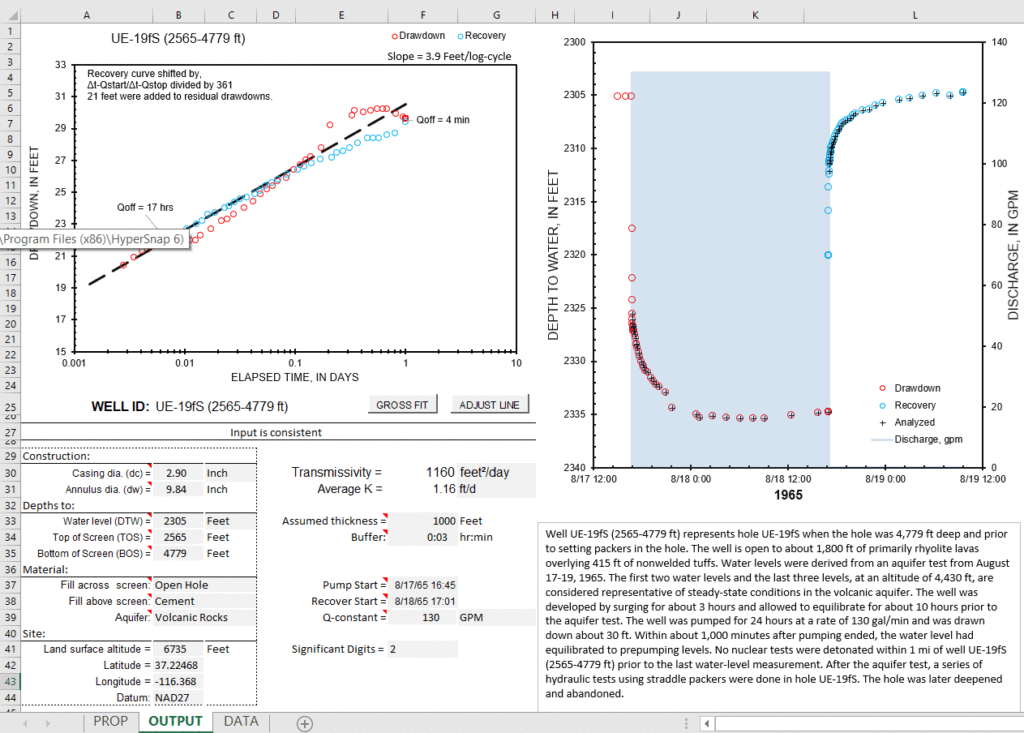
Simultaneous interpretation of Cooper-Jacob (1946) and Theis recovery (Jacob, 1963) methods has been implemented in the workbook CJ-Drawdown+Recovery-2019.xlsm (Figure 2). A continuous series of antecedent, pumping, and recovery water levels in the pumped well are specified as depth to water or water level above the transducer. Analyzable drawdown and residual drawdowns are plotted on a semi-log plot. A straight line initially is regressed to drawdown and recovery data with the “GROSS FIT” button. Fit between straight line and plotted data can be refined visually to ignore outliers with the “ADJUST LINE” button. Transmissivity is reported with a user defined number of significant digits. Average hydraulic conductivity is reported if an assumed thickness is specified.

Figure 2.— OUTPUT page in CJ-Drawdown+Recovery-2019.xlsm with data from well UE-19fS (2565-4779 ft) from Frus and Halford (2018).
CJ-Drawdown+Recovery-2019.xlsm and explanatory PDF can be downloaded with the following link. This workbook and other workbook applications are better used on local drives instead of a network drive. CJ-Drawdown+Recovery-2019.xlsm workbook requires that the Solver is installed and the workbook is not opened from within a zip file. The fitting routine will stop and warn the user if the Solver is not installed. User will be warned and workbook will be closed if opened from within a zip file.
The file CJ-Drawdown+Recovery.v5.zip contains,
- CJ-Drawdown+Recovery.v5.xlsm – Workbook with macros for,
1.) Defining stream, ET area, and wells in user-defined MF6 grid;
2.) Writing family of alternative MF6 models is individual folders and batch files to execute all MF6 models; and
3.) Reading all MF6 model results, reducing output frequency, and synthesizing results in a new workbook. - CJ-Drawdown+Recovery-EXPLAIN.v5.pdf – Explanatory document
Revisions
November 17, 2021—Revisions in version 2 include the following. An error trap was added to the GROSS FIT button so elapsed times of 0 would be ignored while scaling the X-axis of elapsed time.
September 23, 2022—Revisions in version 3 include the following. Equations on hidden CONTROL page were extended so that recovery could be detected after the first 1,000 pairs of observations. A tool for removing non-numeric entries from water-level data and reducing water-level data by averaging was added.
October 18, 2022—Revisions in version 4 include the following. Safeguards were added to check that the Solver is installed and the workbook is not opened from within a zip file.
March 7, 2025—Revisions in version 5 include the following. Revised “Check Data” function on DATA page to pair rows of equations with rows of water-level measurements. Revised plotting equations on CONTROL page so that data sets with only drawdown or only recovery data can be analyzed easily.
Suggested Citation
Halford, Keith, 2025, CJ-Drawdown+Recovery–A workbook for Cooper-Jacob analysis of drawdown and recovery, version 5, Halford Hydrology LLC web page, accessed March 2025, at https://halfordhydrology.com/cj-drawdownrecovery/
References
Cooper, H.H., and C.E. Jacob. 1946. A generalized graphical method for evaluating formation constants and summarizing well field history. American Geophysical Union Transactions 27: 526–534. https://doi.org/10.1029/TR027i004p00526
Halford, K.J. and E.L. Kuniansky 2002, Documentation of spreadsheets for the analysis of aquifer pumping and slug test data, USGS OF 02-197 https://pubs.usgs.gov/of/2002/ofr02197/
Halford, K.J., Weight, W.D., and Schreiber, R.P., 2006, Interpretation of transmissivity estimates from single-well pumping aquifer tests: Groundwater, v. 44, no. 3, p. 467–471, https://doi.org/10.1111/j.1745-6584.2005.00151.x.
Jacob, C.E., 1963, The recovery method for determining the coefficient of transmissibility, in Bentall, R., ed., Methods of determining permeability, transmissibility, and drawdown: U.S. Geological Survey Water-Supply Paper 1536–I, p. 283–292, https://pubs.er.usgs.gov/publication/wsp1536I.
