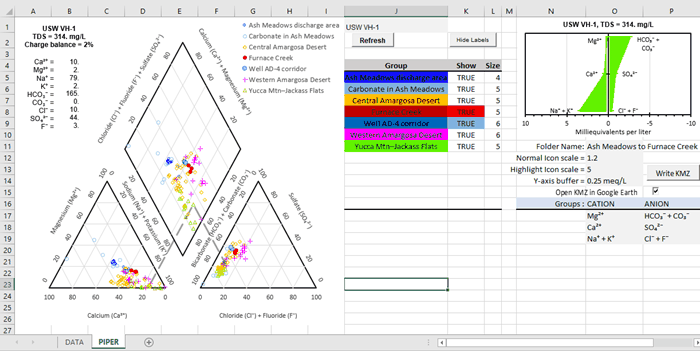
Piper and Stiff diagrams are plotted and mapped, respectively from water-quality concentrations in milligrams per liter (mg/L). The program converts mg/L to milliequivalents per liter (meq/L). Concentration of major ions are summed for total dissolved solids (TDS) and charge balances are computed. Sites are highlighted if charge balances exceed a user-specified threshold. Constituent concentrations and TDS from a site can be selected and highlighted in the Piper plot (Figure 1). A Stiff diagram is displayed for the selected site.

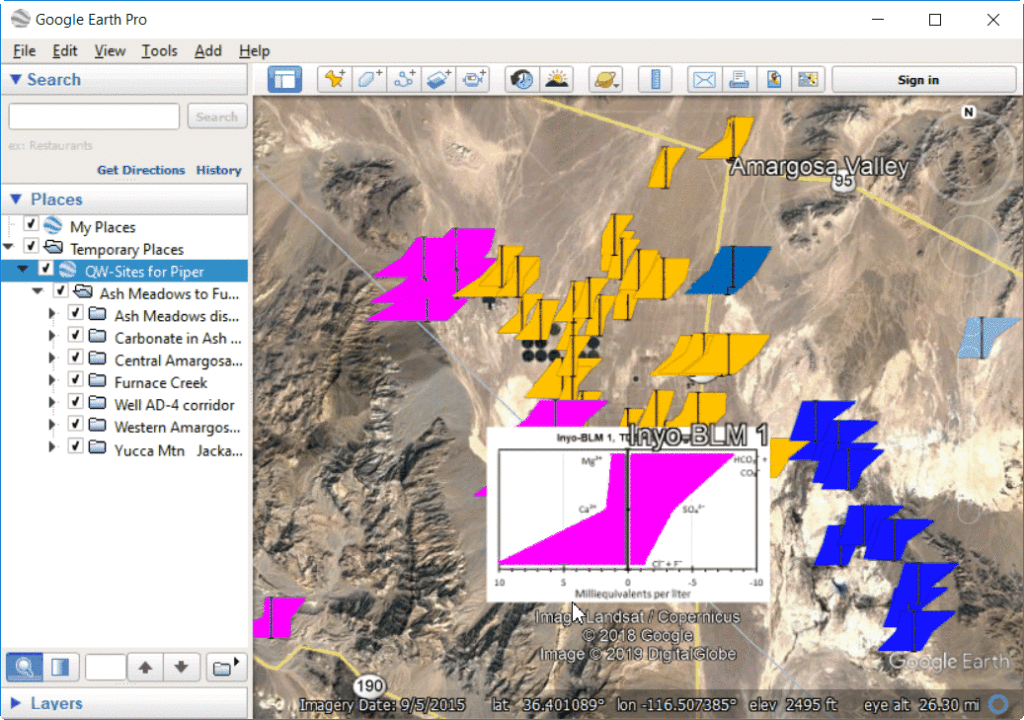
Stiff diagrams are written to a KMZ (Google Earth) file where groups of sites can be viewed or hidden (Figure 2). Stiff icon changes to labeled Stiff diagram with site identifier as mouse hovers over an icon. TDS and constituent concentrations in mg/L are displayed as a table after selecting a site.

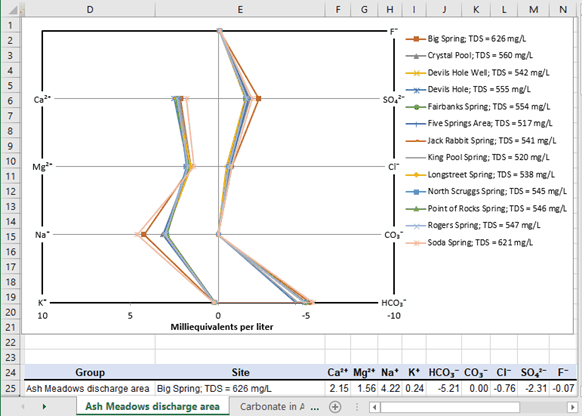
Diagnostic Stiff diagrams also can be created in a new workbook, where each site in a group is diagrammed in a single plot (Figure 3). A page is created for each group of sites with an open Stiff diagram of individual ions for each site. Milliequivalents of anions are plotted as negative values in Cartesian plots and are inverted on log plots.

PiperStiff-QW-2019.xlsm and explanatory PDF can be downloaded with the following link. Site locations, names, and analyte concentrations should be arranged in separate workbook and pasted special as values on the DATA page (see Data Entry).
Macros were developed in Excel 2019 and should work in Excel 2013+. Labels have failed when revised by macros in Excel 2010.
Suggested Citation
Halford, Keith, 2024, Piper and Stiff–A workbook for creating Piper plots and Stiff diagrams, version 10, Halford Hydrology LLC web page, revised July 2024, at https://halfordhydrology.com/piper-and-stiff/
Revisions
October 28, 2019—Revisions in version 2 include the following. Sites can be labeled with numbers rather than just text. Specified minimum and maximum values of milliequivalents per liter in Stiff chart are transferred to minimum and maximum values in Stiff icons that are displayed in Google Earth.
November 25, 2019—Revisions in version 3 include the following. Site names are checked for uniqueness. Non-unique site names are made unique by appending occurrence number to repeated site names. For example, sites MW-A, MW-A, and MW-A will be changed to sites MW-A, MW-A2, and MW-A3.
January 19, 2020—Revisions in version 4 include the following. Macro for writing KMZ was revised so CONTROL sheet with icon chart is activated and refreshed prior to writing images to graphic files. Stiff images sometimes did not appear or appeared as X’s prior to this bug fix.
April 9, 2020—Revisions in version 5 include the following. Macro for writing KMZ was revised so sites can be identified with numerical values such as dates. Site identifiers appear as decimal days from 1/1/1900 if a user insists on using dates as a site name. Percentage calculations in columns AL:AQ on the hidden CONTROL page were revised to treat empty cells as 0 for unspecified chemical concentrations. Both revisions are less bug fixes than enabling less than ideal usage to the workbook.
July 29, 2020—Revisions in version 6 include the following. CONTROL page is left visible so KMZ macro momentarily can activate page prior to writing STIFF images from chart in range BT1:BV2. Stiff images previously sometimes did not appear or appeared as X’s prior to this bug fix. Manually activate the CONTROL page and return to the PIPER page if this error occurs.
January 1, 2021—Revisions in version 7 include the following. Macro for writing KMZ was revised so decimal delimiters in longitude and latitude are written with periods (.) regardless of regional settings in Excel. Thanks to Casper Zoete for identifying and fixing this bug. Functions for plotting Stiff diagrams on a log scale of the X-axis and creating diagnostic Stiff diagrams in a new workbook were added.
May 1, 2021—Revisions in version 8 include the following. Minor correction so that empty columns do not cause diagnostic Stiff macro to fail. Added discussion about entering data as values in a block rather than dragging cells all over the data page.
May 4, 2021—Revisions in version 9 include the following. Macro for writing KMZ was revised so decimal delimiters in icon scales and geochemical summaries are written with periods (.) regardless of regional settings in Excel. Thanks to Eduardo Díaz Jiménez for identifying and fixing this bug.
July 10, 2024—Revisions in version 10 include the following. List of ions was expanded to include Boron (B³⁺), Manganese (Mn²⁺), Copper (Cu⁺), and Iron (Fe²⁺). These ions were specified in cells B17:F20 on the CONTROL page, which is normally hidden. Plottable ions were expanded from 10 to 14 on the DATA page. Further expansion is possible, but not advised. Piper plot labels are unwieldy with greater than 10 ions and likely to become inky masses with greater than 14 ions. Revision at request of Sam North, New South Wales Department of Primary Industries.
